
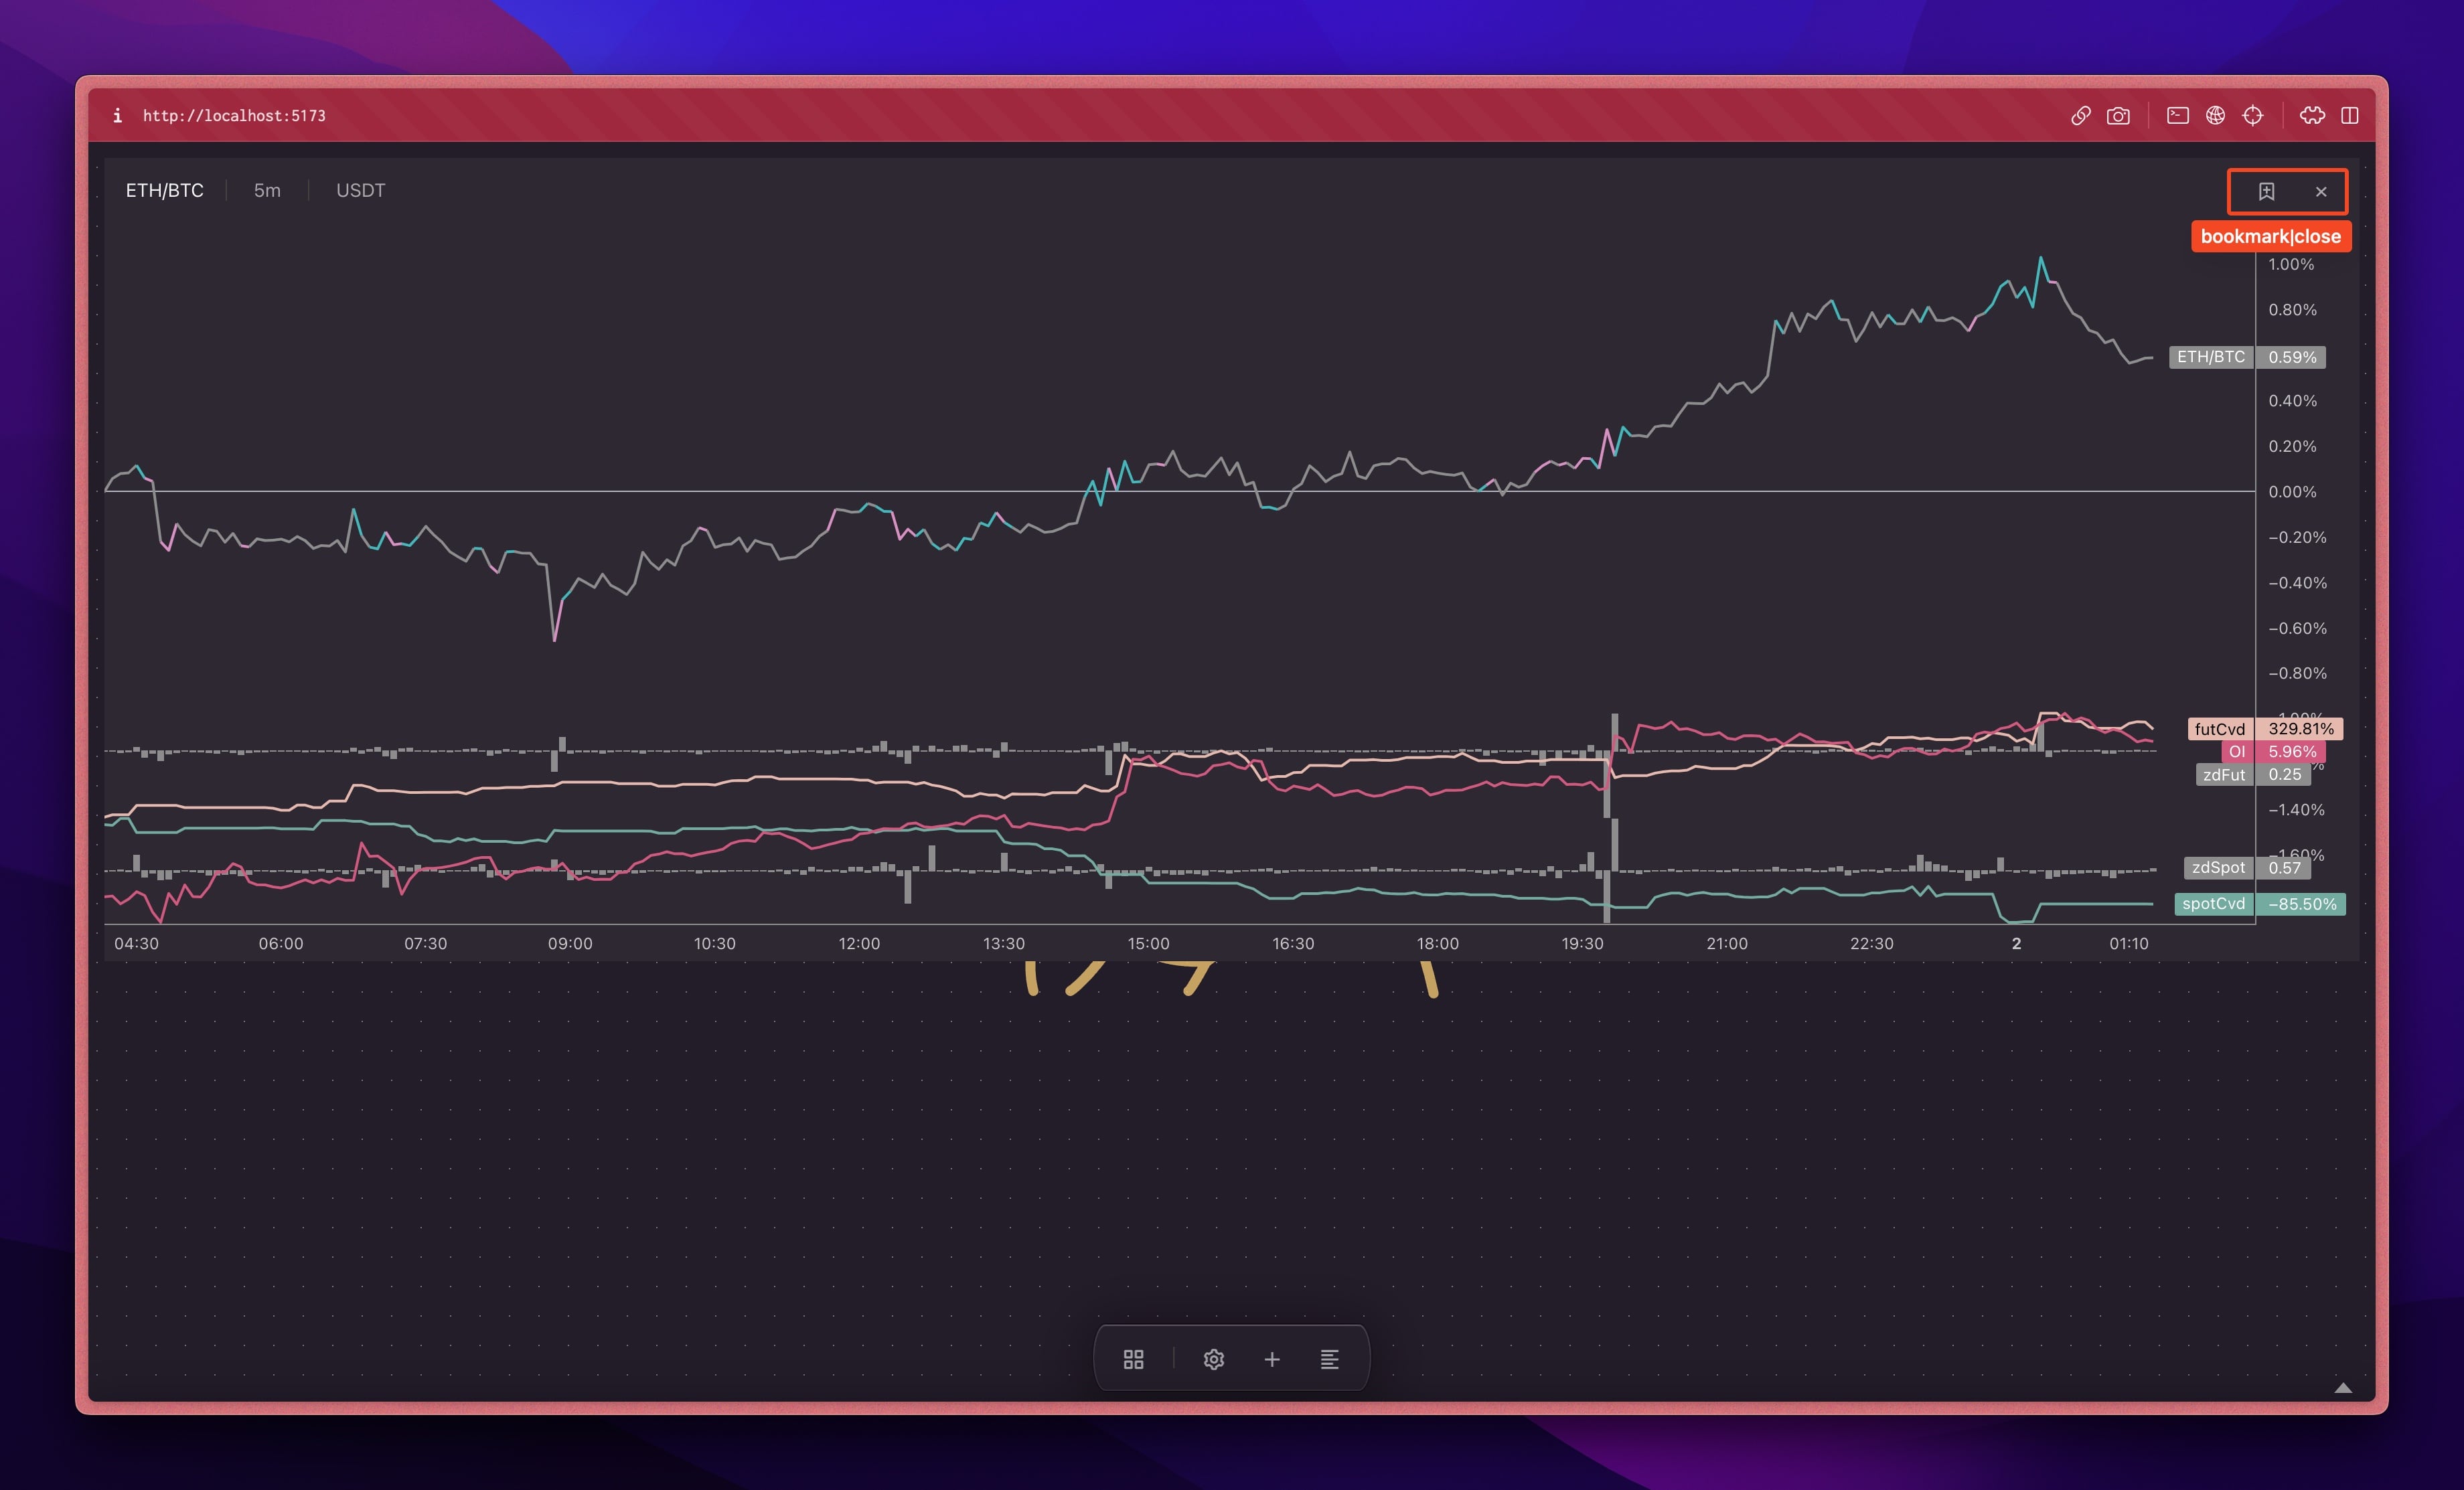
Pair Chart
Indicators
-
OI is cumulative delta from OI's changes of base and quote.
-
zdFut is z-score of relative volume's changes, from future markets of base and quote ticker.
-
zdSpot is z-score of relative volume's changes, from spot markets of base and quote ticker.
-
futCvd is cvd of fut when zdFut is positive. Which means base market's price changes from its own trading activities. Not from correlating with the quote market.
-
spotCvd is cvd of fut when spotFut is positive. Which means base market's price changes from its own trading activities. Not from correlating with the quote market.
-
On chart, Green color shows up when zdFut is larger than 0,5. Pink color shows up when zdFut is less than -0,5.
Because as you already know the crypto markets are heavily correlated. BTC's price movement can affect any market's price movement. So, together, they can help you de-noise price changes, and unearth informed flows.