
Ticker Chart
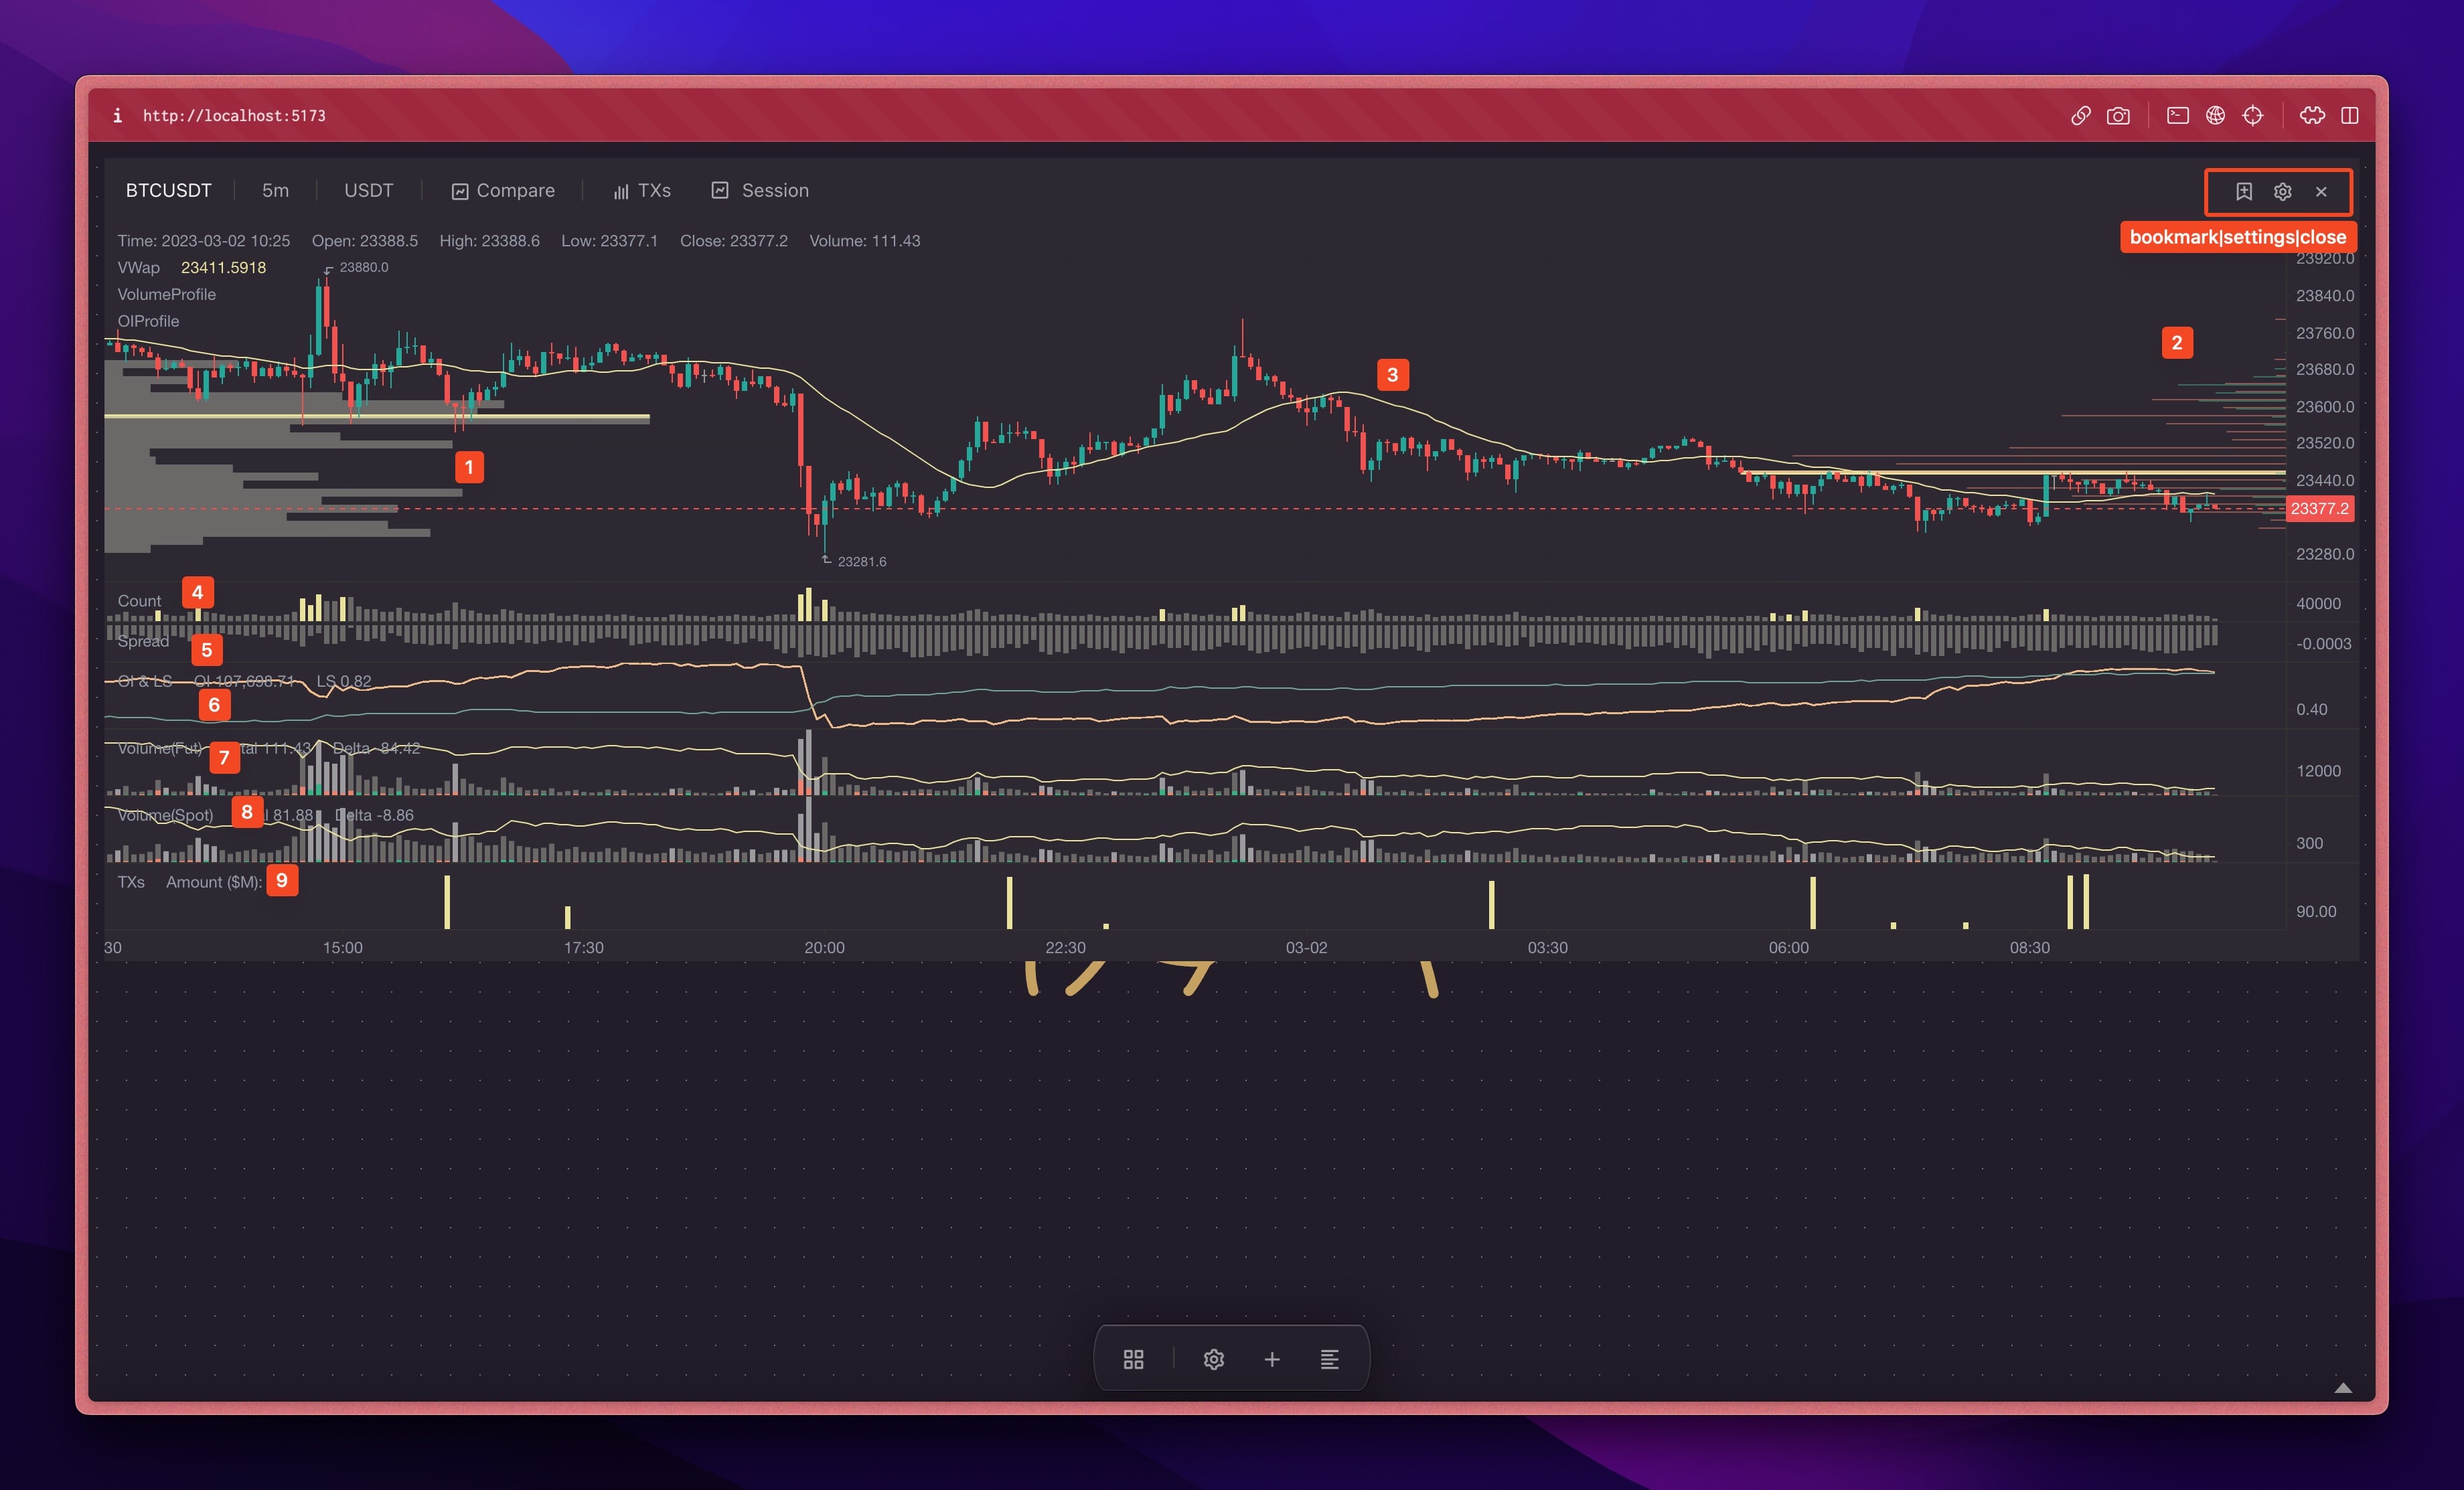
Market data are from Binance.
Indicators
1/ Volume profile, you can change the number of levels in settings.
2/ OI Delta profile. Delta from current and previous period.
3/ OI-WAP is based on absolute value of Open Interest's changes instead of volume. Reason is Volume can be from fake activities like wash trading. OI is total number of contracts from real trading activity.
4/ Count is number of trades.
5/ Spread is Future(High+Low+Close) / Spot(High+Low+Close) - 1
6/ OI is Open Interest (Gold color). LS is global long short account ratio (Desaturated Cyan color).
7/ Volume (Future) is total volume of future market. Red/Green overlay is Delta Volume. Red = delta sell, Green = delta buy. Line is CVD, cumulative volume delta.
8/ Volume (Spot) is same as above, but for spot.
9/ On-chain TXs in USD, if token is same as chart's ticker. Or token is USDT/USDC/BUSD. If token is different than chart's ticker, then they're amount of the token.
TXs
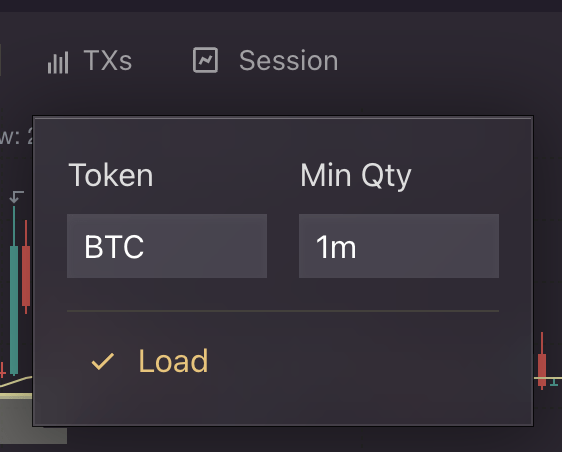
- Add on-chain TXs of any token. Also dex trades for the token on ethereum network.
- Min Qty to filter out small txs. Instead of input full number like 100,000 or 1,000,000, you can enter 100k, 1m.
- For token list, check out Token Flow for more details.
Session
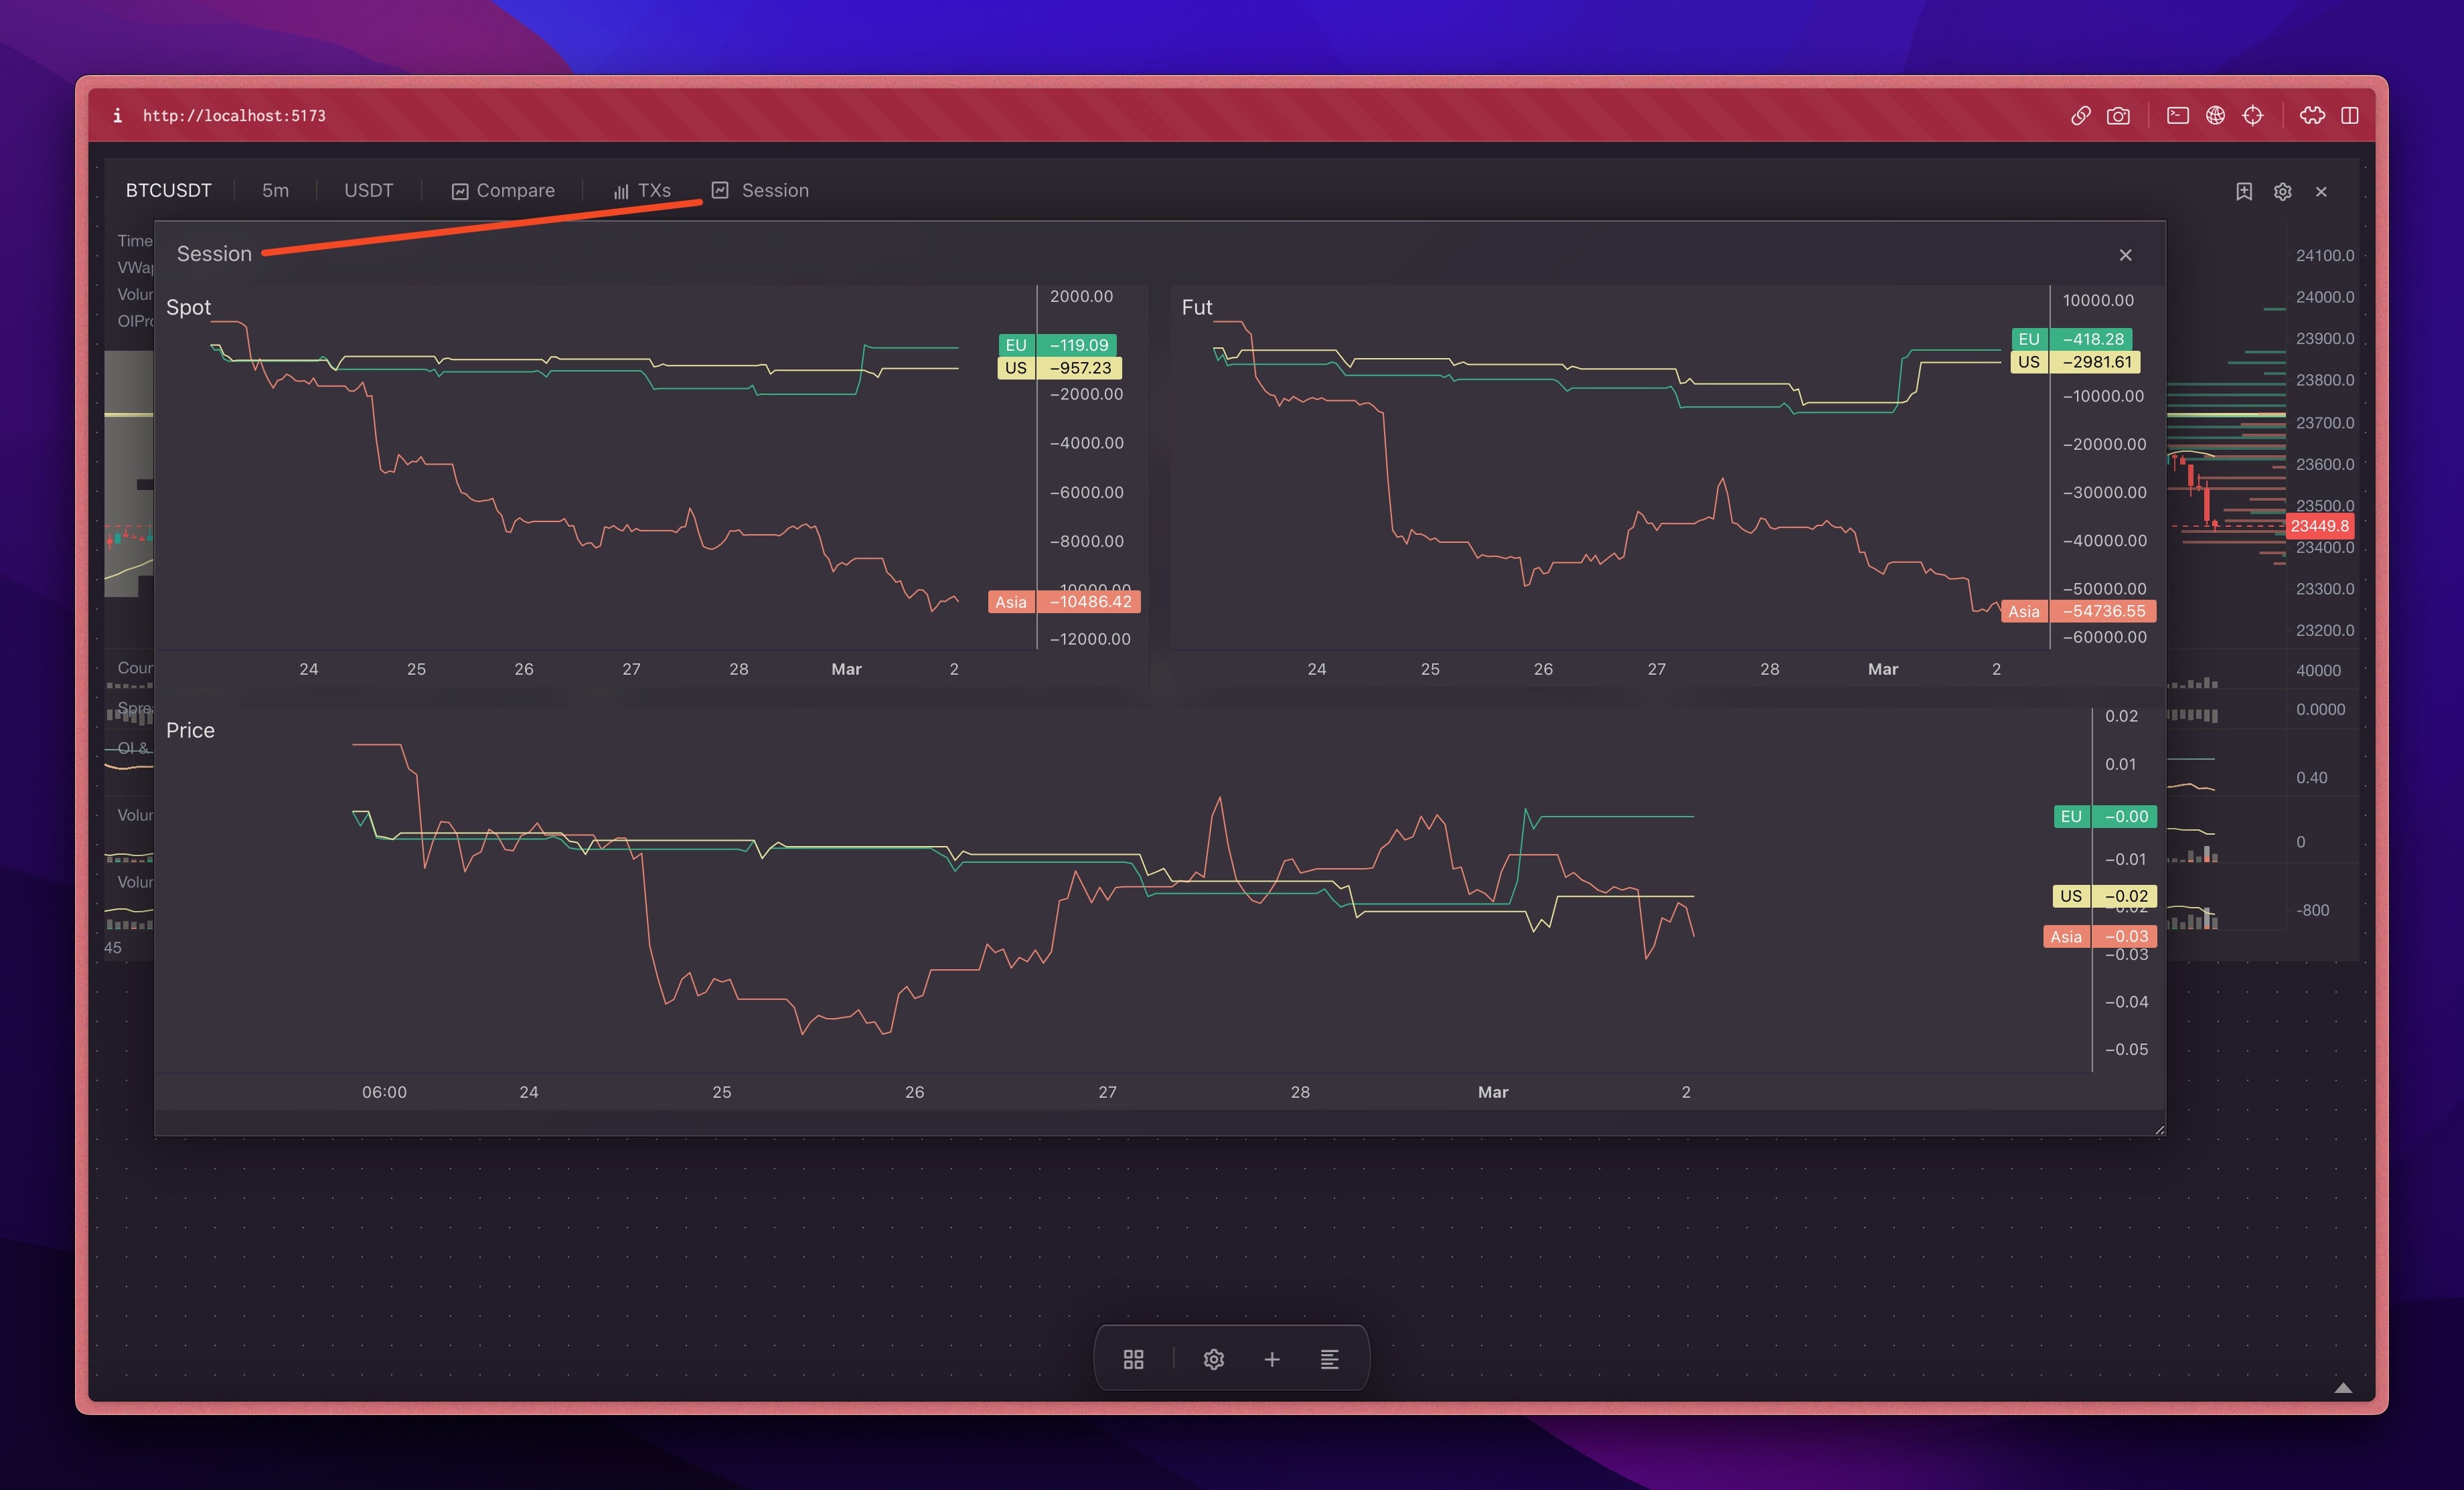
- Separate Spot CVD, Future CVD and Price by session: Asian, EU, US. We can see which session frontruns others.
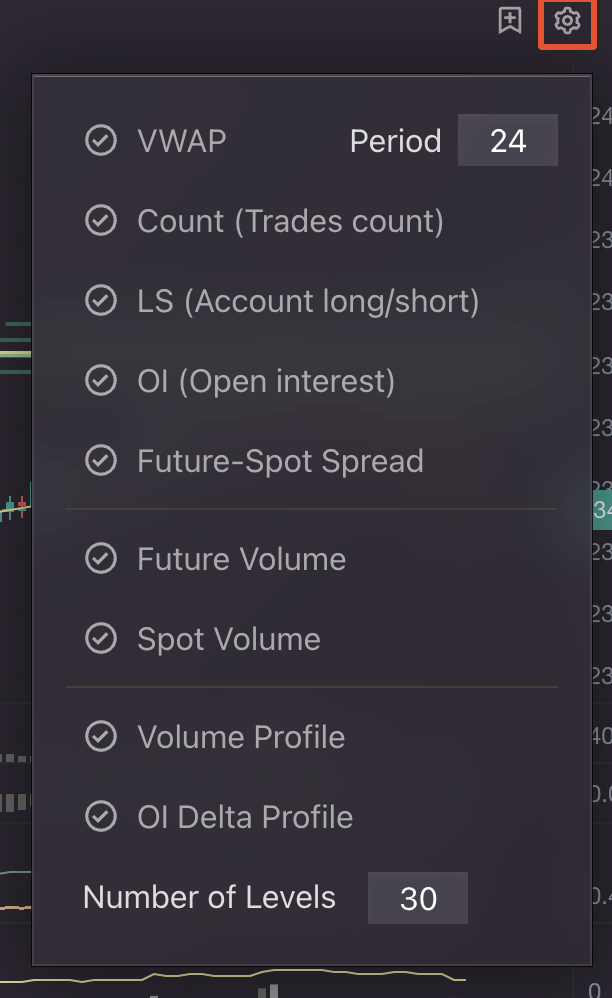
Settings
- USDT/BUSD are quote of a market.
For example: BTCUSDT, BTCBUSD
- 5m/15m/1h are available timeframes.
Customization: You can add more timeframes like 30m, 4h
- You can bookmark the chart to save it to the Watching.
- You can toggle any indicator on/off.